
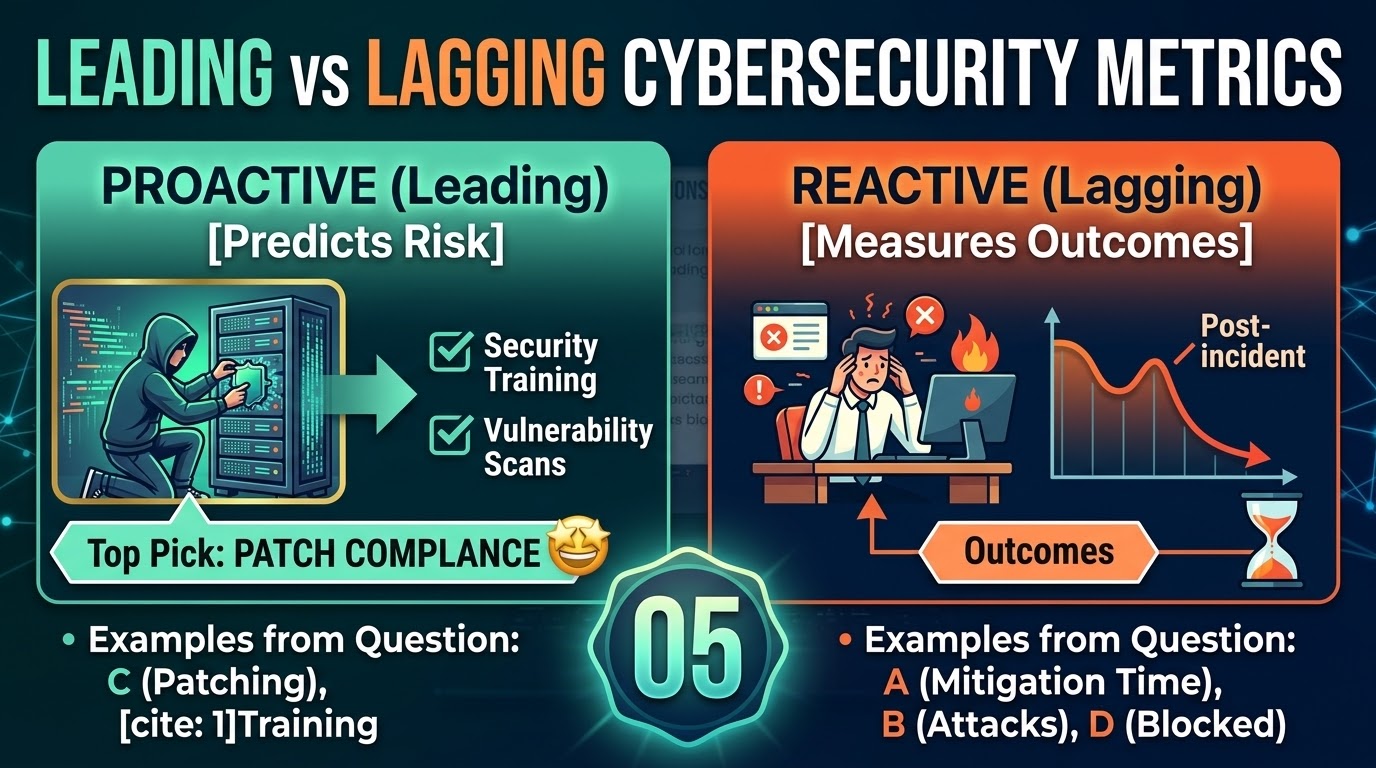
Information Security Metrics: Scenario-Based Practice Questions
Instructions
Review each scenario carefully and select the best answer choice. These questions are designed to test your conceptual understanding of Leading Indicators, Lagging Indicators, and Key Risk Indicators (KRIs) in information security governance and risk management. Answers and rationales are withheld.
Question 1 (DevSecOps & Software Security)
A Chief Information Security Officer (CISO) is implementing a metrics program for an enterprise shifting toward a DevSecOps release model. The engineering leadership wants a metric that serves strictly as a leading indicator to forecast potential post-deployment security vulnerabilities before code reaches the production environment.
Which of the following metrics best fulfills this requirement?
- A. Mean Time to Remediate (MTTR) critical software vulnerabilities discovered during quarterly penetration testing.
- B. Percentage of software developers who successfully completed hands-on secure code training prior to the release cycle.
- C. Total count of critical CVEs identified in production container images during daily vulnerability scans.
- D. Ratio of security defects resolved versus total security defects opened during post-release operations.
Question 2 (Third-Party Risk Management)
An Enterprise Risk Management (ERM) committee requires a cybersecurity metric that functions as an actionable Key Risk Indicator (KRI) for third-party supply chain risk. The committee needs early warning signals when vendor risk exposure approaches or breaches the board-defined risk appetite threshold.
Which metric best serves as a KRI in this scenario?
- A. Total financial losses incurred by the organization resulting from security breaches at vendor facilities over the last fiscal year.
- B. Average time taken by procurement to offboard terminated third-party vendor access accounts.
- C. Percentage of critical vendors with deteriorating security posture scores or unmitigated SOC 2 material deficiencies.
- D. Total count of third-party vendors that signed the organization’s updated Non-Disclosure Agreement (NDA).
Question 3 (Incident Response & SOC Operations)
A Security Operations Center (SOC) manager is presenting annual performance figures to executive leadership to demonstrate the actual effectiveness and operational outcomes of recent investments in automated Incident Response playbooks.
Which metric should the SOC manager highlight as a lagging indicator of incident response performance?
- A. Percentage of endpoints with fully updated and active Endpoint Detection and Response (EDR) agents.
- B. Mean Time to Contain (MTTC) confirmed security incidents over the preceding 12 months.
- C. Frequency of tabletop incident response exercises conducted across business units per quarter.
- D. Number of high-severity alerts correlated per analyst shift following automated triage deployment.
Question 4 (Board Reporting & Security Governance)
During a board meeting, the CISO is asked to present a metric that evaluates internal control efficacy and operational security readiness (leading indicator) rather than measuring external threat activity or operational noise.
Which of the following metrics best satisfies the board’s request?
- A. A 35% increase in malicious connection attempts blocked by perimeter firewalls over the last 30 days.
- B. The total volume of phishing emails quarantined by email filtering gateways during peak business hours.
- C. Percentage increase in multi-factor authentication (MFA) compliance across privileged user accounts.
- D. Total dollar value of regulatory fines levied against industry competitors for data protection non-compliance.
Question 5 (Risk Tolerance & KRI Threshold Design)
An organization’s risk appetite statement explicitly caps acceptable exposure to unpatched critical infrastructure at 5 business days. The CISO must establish a Key Risk Indicator (KRI) dashboard metric with an automated threshold trigger to alert management before breaching this defined risk tolerance limit.
Which metric configuration represents the most effective KRI design?
- A. Percentage of critical servers with unapplied high-severity patches that are 3 to 4 days old.
- B. Mean Time to Patch (MTTP) critical vulnerability advisories published by US-CERT.
- C. Total number of zero-day vulnerabilities announced globally by security researchers per month.
- D. Elapsed time required to restore a compromised core database server from bare-metal backups.
ANSWERS TO THE QUESTIONS!
Question 1: DevSecOps & Software Security
Correct Answer: B. Percentage of software developers who successfully completed hands-on secure code training prior to the release cycle.
- Why B is Right: Secure coding training is a leading indicator. It builds technical competency before software is engineered, preventing security flaws at the root level before code reaches testing or production environments.
- Why A is Wrong: Mean Time to Remediate (MTTR) measures how fast vulnerabilities are fixed after they have already been introduced and identified during testing. This makes it a lagging operational metric.
- Why C is Wrong: Counting CVEs in production container images reflects vulnerabilities that already exist in live environments, making it a lagging risk metric.
- Why D is Wrong: The ratio of resolved versus opened post-release defects measures operational remediation throughput after software deployment, making it a lagging performance metric.
Question 2: Third-Party Risk Management
Correct Answer: C. Percentage of critical vendors with deteriorating security posture scores or unmitigated SOC 2 material deficiencies.
- Why C is Right: A Key Risk Indicator (KRI) must provide early warning signal of changes in risk exposure relative to risk appetite. Tracking security posture degradation and audit findings signals heightened threat exposure before a third-party security incident or data breach occurs.
- Why A is Wrong: Tracking actual financial losses from vendor security breaches measures past impact after the damage has occurred, making it a lagging outcome metric.
- Why B is Wrong: Offboarding turnaround time evaluates procurement and IT operational efficiency, serving as a Key Performance Indicator (KPI) for administrative workflows rather than a KRI.
- Why D is Wrong: The total number of signed NDAs measures administrative compliance completion, not the actual security posture or technical risk level of the vendors.
Question 3: Incident Response & SOC Operations
Correct Answer: B. Mean Time to Contain (MTTC) confirmed security incidents over the preceding 12 months.
- Why B is Right: Lagging indicators measure historical results and operational performance after events take place. MTTC quantifies the actual efficiency of response actions during past incident lifecycles.
- Why A is Wrong: EDR agent coverage measures baseline security posture and operational deployment completeness before incidents occur, making it a leading/readiness indicator.
- Why C is Wrong: Conducting tabletop exercises builds operational preparedness and evaluates playbook readiness proactively, functioning as a leading capability indicator.
- Why D is Wrong: Alert volume per shift measures SOC operational throughput and telemetry load, functioning as an operational workload metric rather than an outcome metric.
Question 4: Board Reporting & Security Governance
Correct Answer: C. Percentage increase in multi-factor authentication (MFA) compliance across privileged user accounts.
- Why C is Right: MFA compliance evaluates internal governance efficacy and security posture strength (leading indicator). Enhancing MFA implementation directly predicts a reduced risk of credential theft and identity compromise.
- Why A is Wrong: Blocked perimeter connection attempts measure external threat activity and environmental scanning noise, not internal control efficacy or security readiness.
- Why B is Wrong: Quarantined phishing email volume reflects incoming threat frequency and gateway throughput rather than defensive control posture or user readiness.
- Why D is Wrong: Fines levied against industry competitors serve as external benchmark indicators, not internal security metrics.
Question 5: Risk Tolerance & KRI Threshold Design
Correct Answer: A. Percentage of critical servers with unapplied high-severity patches that are 3 to 4 days old.
- Why A is Right: An effective KRI relies on leading indicators paired with early warning thresholds. By tracking unpatched servers at days 3 to 4, management gets an automated trigger to intervene before exceeding the 5-day risk tolerance limit.
- Why B is Wrong: Mean Time to Patch (MTTP) calculates historical average performance across all advisories. A steady average can easily mask specific critical systems that have breached the 5-day tolerance threshold.
- Why C is Wrong: Global zero-day announcements track external threat discovery across the industry, over which the enterprise has no direct control or internal threshold measurement.
- Why D is Wrong: Database restoration time measures disaster recovery and operational resiliency after a system compromise, making it a lagging recovery metric.

